How to get a visual overview of your Office 365 license consumption
In the trend of my recent blog post I create a new addition to my automation of Office 365 tasks. This time creating a report with the license consumption per month with PowerShell automation, Azure table storage and Power BI. In this post I will take you with me thru the steps to set this up.
What do we need?
Before we can get started coding we need to do some plumbing first. The first thing we need is a storage account. From this storage account we need the connection string.
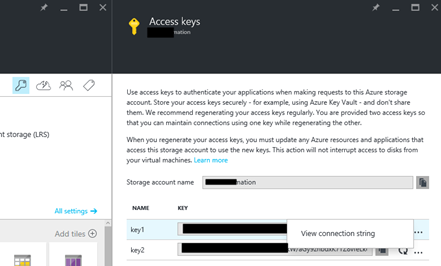
It is a bit hidden in the new portal. To get it, go to the storage account and click on the key icon. From there you see two keys and behind it three dots, when you click on those dots you get the complete connection string.
We also need a Power BI subscription; the free version is sufficient for the report I created. For this just go to http://powerbi.com.
PowerShell
Now let’s get started with the code part. First we create two automation variables, one for the connection string to the storage account and one for the name for the table we are going to use. The variable can be configured in the automation account in the Azure Portal or in PowerShell ISE with the Azure Automation ISE add-on. Besides the variables we also need an account that can connect to Office 365. See my previous post about Azure automation
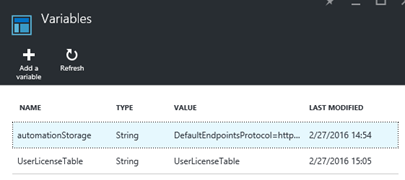
Now that we have those two variables we can get start coding.
First we get the variables and connections setup that we created before. After the connections are created we can check if the table storage exists, if not create it. Now we can get all the users that have a license and get the UserPrincipalName, DisplayName and Licenses property for those users. We have all users and we can start adding them to table storage, I have chosen to create the partition key from the current date with the SkuPartNumber and the UserPrincipalName as the RowKey. All other properties can be added as a property to the object.
The full PowerShell code is below.
Now that we have the script we can add a schedule to run it once every week or once a month depending on your requirements.
Power BI
Now that we have all the data of our users in Table storage we can create a Power BI report. We need the Power BI desktop client for this and can be downloaded from the Power BI website once your logged in.
When you start the client you get the question to ‘Get Data’, click that one and search for Azure Table.
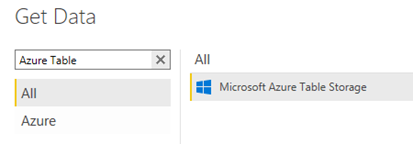
Select ‘Microsoft Azure Table Storage’ and click on ‘Connect’. Fill in the storage account name and the key.
You now get an overview of all the tables in your storage account and select the storage account that you used in the PowerShell script. Because not all content of your table storage is loaded click on the ‘Edit’ button below the preview, this will load the ‘Query Editor’. Click on the icon in the column ‘Content’.

This will expand all columns. Now you can rename the columns if you want and change the column types, I did that for the column Date.

We have imported the data and now we can create our report, your imagination is your limit here. I have created a simple report to start.
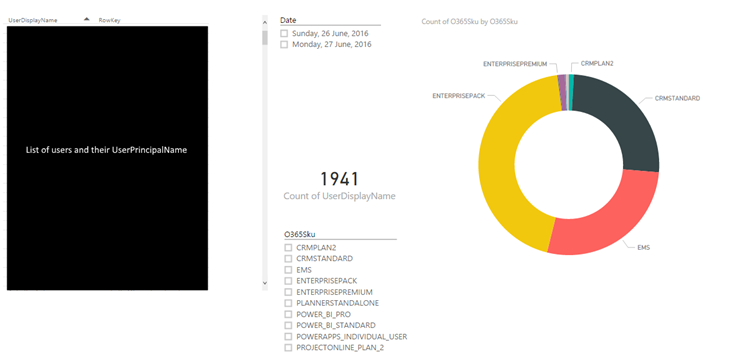
The report is interactive and will filter when you click on a date or on a SKU.
When you are happy with your report you can publish it to Power BI and create a dashboard from this to share within the company.
Conclusion
With the combination of Azure Automation and Power BI we can give the business great insight into the usage of Office 365 and what they are paying for. For this demo I only got the user and the SKU that is used, but you also can combine this data with your Active Directory information to get filters on department, country or business unit.
Azure Automation toolkit
I have created a greated a great toolkit to get started with Azure Automation and PowerShell. Have a look at the https://worktogether.tech/m365-toolkit